Streaming live events#
The event-by-event calling mode lets you react to each value the moment it lands, before the next one arrives, in constant memory. That means the source can be unbounded: a live socket, a clock tick, a sensor feed with no natural end. The function itself is identical to the one you develop and test on stored history.
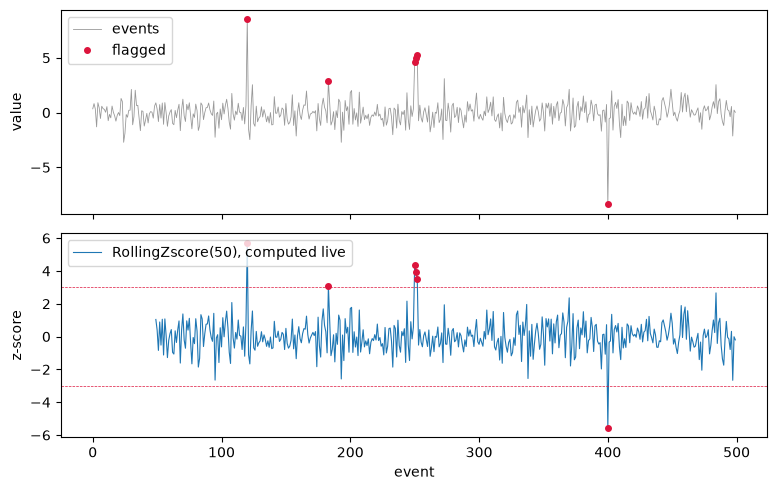
The example is a simple monitor. It keeps a rolling z-score of the incoming values and flags any value that moves more than three standard deviations from its recent average.
import numpy as np
import matplotlib.pyplot as plt
from screamer import RollingZscore

rng = np.random.default_rng(1)
x = rng.standard_normal(500)
x[120]     += 7      # inject a few anomalies for the monitor to catch
x[250:253] += 5
x[400]     -= 7
A live signal, event by event#
Build the function once and feed it each value as it arrives. It keeps just enough state to return the next z-score, and you can act on that value immediately, here by recording an alert whenever the score crosses the threshold.
threshold = 3.0

z = RollingZscore(50)
zscore = []
alerts = []
for i, v in enumerate(x):              # imagine each v arriving from a socket or queue
    zi = z(v)
    zscore.append(zi)
    if not np.isnan(zi) and abs(zi) > threshold:
        alerts.append((i, zi))         # react the moment it happens

print(f"{len(alerts)} events crossed |z| > {threshold:.0f}")
for i, zi in alerts[:3]:
    print(f"  event {i}: z = {zi:+.2f}")
6 events crossed |z| > 3
  event 120: z = +5.72
  event 183: z = +3.10
  event 250: z = +4.37
zscore = np.array(zscore)
flags = np.where(np.abs(zscore) > threshold)[0]

fig, (ax_raw, ax_z) = plt.subplots(2, 1, figsize=(8, 5), sharex=True)

ax_raw.plot(x, lw=0.6, color="0.6", label="events")
ax_raw.plot(flags, x[flags], "o", color="crimson", ms=4, label="flagged")
ax_raw.set_ylabel("value")
ax_raw.legend(loc="upper left")

ax_z.plot(zscore, lw=0.8, label="RollingZscore(50), computed live")
ax_z.axhline(threshold, color="crimson", lw=0.5, ls="--")
ax_z.axhline(-threshold, color="crimson", lw=0.5, ls="--")
ax_z.plot(flags, zscore[flags], "o", color="crimson", ms=4)
ax_z.set_ylabel("z-score")
ax_z.set_xlabel("event")
ax_z.legend(loc="upper left")

plt.tight_layout()
Streams with no end#
The lazy-iterator mechanic (passing a generator to a function and pulling one value at a time) is covered in notebook 01. Applied here to an endless sensor feed, the same pattern runs in constant memory regardless of how long the source runs. Bind the operator to a name before passing it a generator; if you keep it only in a temporary, Python may free it while the iterator is still live.
def sensor():
    "A source that never stops, e.g. a socket or a clock."
    while True:
        yield rng.standard_normal()

monitor = RollingZscore(50)          # bind to a name so it stays alive
stream = monitor(sensor())           # a lazy iterator; nothing computed yet
first_1000 = [next(stream) for _ in range(1000)]

print(f"pulled {len(first_1000)} values from an endless source; memory stays flat")
pulled 1000 values from an endless source; memory stays flat