Financial indicators: several inputs and outputs#
Many indicators do not fit the one-series-in, one-series-out shape. ATR and the Stochastic oscillator need high, low, and close as separate inputs. Bollinger Bands and MACD return several components at once: three bands, or a line, a signal, and a histogram.
screamer handles both patterns with the same calling convention. Multiple inputs go in as separate arrays, or as a single matrix with one column per series. Multiple outputs come back as a matrix whose columns you unpack one by one. This notebook demonstrates both patterns; the full catalog is in the function reference.
import numpy as np
import matplotlib.pyplot as plt
from screamer import ATR, MACD, BollingerBands

rng = np.random.default_rng(2)
close = 100 + np.cumsum(rng.standard_normal(400))
high  = close + np.abs(rng.standard_normal(400))
low   = close - np.abs(rng.standard_normal(400))
Several outputs: components from one series#
BollingerBands and MACD each take a single price series and return a
(T, 3) array. The trailing axis holds the components, so transposing lets you
unpack them into named series in one line.
bb = BollingerBands(20)(close)
lower, mid, upper = bb.T                 # unpack the three columns

macd = MACD()(close)
macd_line, macd_signal, macd_hist = macd.T

print(f"BollingerBands -> {bb.shape}: lower, mid, upper")
print(f"MACD           -> {macd.shape}: line, signal, histogram")
BollingerBands -> (400, 3): lower, mid, upper
MACD           -> (400, 3): line, signal, histogram
Several inputs: OHLC as arrays or a matrix#
ATR needs high, low, and close. Pass them as three separate arrays, or stack
them into a single (T, 3) matrix and pass that. The two forms are equivalent.
atr = ATR(14)(high, low, close)              # three separate series
hlc = np.column_stack([high, low, close])    # or one (T, 3) matrix
atr2 = ATR(14)(hlc)

print(f"ATR -> {atr.shape}")   # same result from both forms
ATR -> (400,)
Both patterns on one chart#
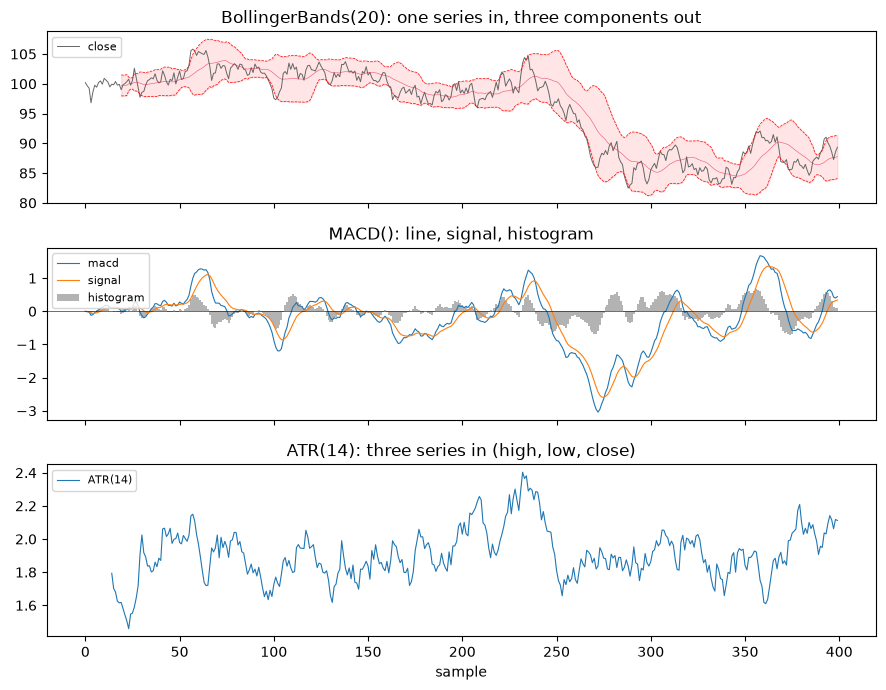
Both patterns appear together below: the top two panels are multi-output indicators that take a single price series and return several columns, and the bottom panel is a multi-input indicator that takes three separate series.
xs = np.arange(len(close))

fig, ax = plt.subplots(3, 1, figsize=(9, 7), sharex=True)

ax[0].plot(close, lw=0.7, color="0.4", label="close")
ax[0].plot(mid, color="crimson", lw=0.4, alpha=0.7)
ax[0].plot(lower, "r--", lw=0.5)
ax[0].plot(upper, "r--", lw=0.5)
ax[0].fill_between(xs, lower, upper, alpha=0.1, color="r")
ax[0].set_title("BollingerBands(20): one series in, three components out")
ax[0].legend(loc="upper left", fontsize=8)

ax[1].plot(macd_line, lw=0.8, label="macd")
ax[1].plot(macd_signal, lw=0.8, label="signal")
ax[1].bar(xs, macd_hist, color="0.7", width=1.0, label="histogram")
ax[1].axhline(0, color="k", lw=0.4)
ax[1].set_title("MACD(): line, signal, histogram")
ax[1].legend(loc="upper left", fontsize=8)

ax[2].plot(atr, lw=0.8, label="ATR(14)")
ax[2].set_title("ATR(14): three series in (high, low, close)")
ax[2].set_xlabel("sample")
ax[2].legend(loc="upper left", fontsize=8)

plt.tight_layout()